Category:Graphs
Jump to navigation
Jump to search
Note: Images should not be categorized here.
This is a disambiguation – a navigational aid which lists categories that might otherwise share the same name.
This category page should not hold any files. See also: Special:Categories/Graphs, Special:PrefixIndex/Category:Graphs, Wikidata or categories with "Graphs" in name |
|
Graphs may refer to:
- Category:Graphs (graph theory) as studied in Category:Graph theory
- Category:Plots, such as Graphs of functions, see for example Category:Function plots and Category:SVG x-y functions.
- Category:Charts
- Category:Diagrams
Wikimedia disambiguation page | |||||
| Instance of | |||||
|---|---|---|---|---|---|
| |||||
Subcategories
This category has only the following subcategory.
G
Media in category "Graphs"
The following 200 files are in this category, out of 266 total.
(previous page) (next page)-
0502 grafo zuzendua.png 895 × 913; 25 KB
-
0503konigsberg-grafoa.png 180 × 132; 4 KB
-
2020 04 21 - Gabinete crisis y posterior rueda de prensa (49801918707).jpg 3,008 × 2,000; 3.28 MB
-
2023 Israel-Gaza war death toll graph.png 942 × 531; 45 KB
-
2024BCCOpinionPolling.png 789 × 574; 16 KB
-
2024BCCOpinionPollingWards.png 789 × 574; 13 KB
-
3D graphing problem.png 733 × 733; 78 KB
-
3dlassoridge.png 1,400 × 700; 217 KB
-
500k (5141388411).jpg 823 × 445; 123 KB
-
Aberavon Election Results 1918-2019.png 3,017 × 1,516; 171 KB
-
Aberdeen North Results 1900-2019.png 3,349 × 1,531; 243 KB
-
Airdrie & Shotts Results 1997-2021.png 2,546 × 1,498; 124 KB
-
Aki-Imuro sta graph.jpg 402 × 279; 23 KB
-
Alyn & Deeside Results 1983-2019.png 2,590 × 1,576; 126 KB
-
Angus Results 1997-2019.png 2,546 × 1,498; 119 KB
-
AR DEM SCORE.png 2,178 × 1,452; 186 KB
-
Ashford Results 1900-2019.png 3,460 × 1,625; 192 KB
-
Ashton-Under-Lyne Results 1900-2019.png 3,460 × 1,739; 243 KB
-
Australian lithium exports.svg 531 × 351; 42 KB
-
Auswertung Studienteilnehmer SMART-Analyse BMII.png 1,183 × 769; 616 KB
-
Average working hours per worker.png 1,299 × 917; 159 KB
-
Avnance del minêyolodjince.jpg 418 × 361; 35 KB
-
AYool CFC-113 history.png 1,700 × 1,429; 84 KB
-
Balloon Diameter.png 600 × 371; 14 KB
-
Baum grammatik fuer satz.png 696 × 489; 23 KB
-
Biggs-Smith Graph.png 6,300 × 6,251; 740 KB
-
Bluesky Registered Users.svg 960 × 576; 38 KB
-
CAISO 05-23-2023 2.png 1,101 × 534; 103 KB
-
Camino Euleriano.png 508 × 508; 14 KB
-
Cas4wiki plot3d 01.png 1,472 × 881; 257 KB
-
Cass-review-figure-34.png 841 × 623; 55 KB
-
Children smoking and drinking in Wales.png 668 × 539; 110 KB
-
Chronopilic prefererred ages graph (blank).png 2,000 × 1,951; 66 KB
-
Chronopilic prefererred ages graph (english).png 2,000 × 1,951; 103 KB
-
Chronopilic prefererred ages graph (french).png 2,000 × 1,951; 104 KB
-
Chronopilic prefererred ages graph (german).png 2,000 × 1,951; 105 KB
-
Chronopilic prefererred ages graph (italian).png 2,000 × 1,951; 100 KB
-
Chronopilic prefererred ages graph (spanish).png 2,000 × 1,951; 101 KB
-
Citation graph of A simple method for detecting chaos in nature.png 938 × 712; 431 KB
-
Citation Graph of Optical Tweezers in Studies of Red Blood Cells - 2.png 855 × 714; 344 KB
-
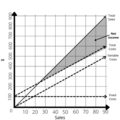
Cost Profit Volume Graph.png 445 × 445; 63 KB
-
COVID-19 related Wikimedia pageviews, 2019-2022, pageviews by access method.png 1,997 × 1,000; 180 KB
-
COVID-19 related Wikimedia pageviews, 2019-2022, pageviews by continent.png 1,997 × 1,000; 221 KB
-
COVID-19 related Wikimedia pageviews, 2019-2022, pageviews.png 1,997 × 1,000; 164 KB
-
CREATE Program Status Chart.png 1,368 × 908; 53 KB
-
CungCau.png 1,011 × 492; 200 KB
-
Curva de Gompertz para EEUU en 2003.svg 400 × 400; 9 KB
-
Cyprus share of renewables.png 1,000 × 600; 46 KB
-
Darwinian appraisals.gif 427 × 206; 11 KB
-
Demography of Igriés from 1900 to 2020.png 650 × 350; 11 KB
-
Diagram of the causes of mortality in the army Wellcome L0050236.jpg 6,066 × 4,378; 4.47 MB
-
Difúze v alveolu.png 1,901 × 807; 24 KB
-
Dimot absolute numbers.svg 790 × 464; 14 KB
-
DiMoT Demo Probability.svg 1,229 × 342; 14 KB
-
Dimot density function.svg 815 × 443; 13 KB
-
Directed NetworkX Graph.png 515 × 389; 25 KB
-
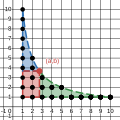
Dirichlet hyperbola example 1.png 488 × 493; 18 KB
-
Dirichlet hyperbola example 4.svg 800 × 800; 69 KB
-
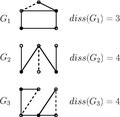
Dissociation number.pdf 458 × 447; 35 KB
-
Downtown Gaming vs Non Gaming.png 912 × 662; 30 KB
-
Dsc 0539 Jpg (115242903).jpeg 2,048 × 1,181; 536 KB
-
DSD(t-A(d)) Ingestion I-131 2014-12-10.png 960 × 720; 42 KB
-
DSD(t-A-m3) I131 Inhalation 2014-12-10.png 960 × 720; 54 KB
-
Early-Stopping Graph.png 1,442 × 1,168; 87 KB
-
Endlicher automat natuerliche zahl.svg 540 × 328; 21 KB
-
Energiemengen 2.png 459 × 318; 8 KB
-
Enhanced-skyrmion-stability-due-to-exchange-frustration-41598 2017 12525 MOESM3 ESM.ogv 19 s, 4,000 × 2,000; 16.3 MB
-
EquaGRAPH Graph pad by points page.jpg 561 × 608; 124 KB
-
Example English Phonological System in Relational Network Notation.png 1,084 × 696; 92 KB
-
Explanation for regression discontinuity design in japanese.png 521 × 433; 13 KB
-
Express service graph.png 860 × 581; 46 KB
-
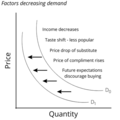
FactorsDecreasingDemand.png 445 × 445; 61 KB
-
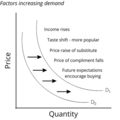
FactorsIncreasingDemand.png 445 × 445; 59 KB
-
Fallecidos siniestros viales Chile 1972-2019.jpg 1,134 × 509; 125 KB
-
Fermion doubling dispersion relation.svg 576 × 432; 16 KB
-
Fisher's Polygenic Model.png 1,000 × 600; 39 KB
-
Five pillars of Wikipedia alternate version.svg 512 × 768; 1.54 MB
-
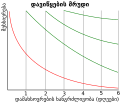
ForgettingCurve.Georgian.svg 277 × 237; 8 KB
-
Free-fall-sim.svg 567 × 319; 16 KB
-
Full Fst Average.png 11,700 × 11,700; 5.19 MB
-
Functions (graph).jpg 310 × 505; 11 KB
-
Fuzzy alt zugehoerigkeit.png 605 × 340; 12 KB
-
Gaskosten.png 482 × 287; 7 KB
-
GIF012-Recta-en-R3-director-paso.gif 698 × 508; 3.79 MB
-
Graph (y = 0.5x - 1).png 1,275 × 675; 73 KB
-
Graph (y = 0.5x - 1).svg 512 × 384; 2 KB
-
Graph depicting grave goods at Campo Consolino.png 620 × 604; 124 KB
-
Graph displaying observed and predicted Australian Post Output Value over time.png 5,069 × 3,300; 999 KB
-
Graph of Merry Hill Local Election Results.png 1,920 × 940; 125 KB
-
Graph of the number of earthquakes.svg 512 × 512; 125 KB
-
Graph23232332.png 560 × 420; 14 KB
-
GraphComparingAnnualRidersKLMonorail.png 607 × 450; 45 KB
-
Graphe projeté sur les noeuds correspondants aux personnes.jpg 3,024 × 1,733; 2.89 MB
-
Graphical representation of cubic polynomials.jpg 1,920 × 1,200; 302 KB
-
Graphs-vocabulary.svg 512 × 446; 2 KB
-
Grasp of a Quadratic function.jpg 2,112 × 2,052; 4.67 MB
-
Gráfica encuestas primarias PNP.png 2,612 × 1,310; 214 KB
-
Gráfica primarias PPD.png 2,607 × 1,306; 220 KB
-
H2h record w.png 640 × 480; 30 KB
-
H2h record.png 640 × 480; 30 KB
-
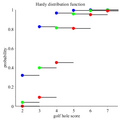
Hardy cdf.svg 500 × 500; 46 KB
-
Hardy Lines cdf.png 400 × 400; 11 KB
-
Hardy Lines pmf.png 400 × 400; 16 KB
-
Hardy pmf.svg 500 × 500; 52 KB
-
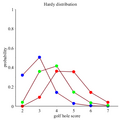
Hardy probability distribution.png 400 × 400; 17 KB
-
HD@DH.nrw fiktives Diagramm.svg 512 × 389; 8 KB
-
Histogram of cross-site leaks cache timing attack example.png 4,500 × 1,500; 240 KB
-
Holocaust Denial Laws 2022.svg 2,754 × 1,398; 1.05 MB
-
Holocaust Denial Laws 2023.png 2,560 × 1,300; 400 KB
-
How do we get behind^ One day at a time. - Flickr - brewbooks.jpg 1,133 × 836; 54 KB
-
Hyperbola graph.png 800 × 800; 105 KB
-
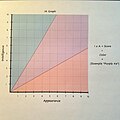
IA graph.jpg 3,024 × 3,024; 4.08 MB
-
Inclusive Wealth Per capita.jpg 796 × 575; 55 KB
-
Indice pilaf.png 1,592 × 1,150; 103 KB
-
InverseTangentIntegral.svg 576 × 432; 17 KB
-
Ionizacijska energija.png 800 × 333; 59 KB
-
Irwin modification.jpg 1,450 × 894; 75 KB
-
Isotherme Typ1.jpg 2,226 × 1,824; 2.05 MB
-
Japanese-School-in-London students-and-teachers-number-data 2023-05.svg 9,877 × 5,692; 128 KB
-
Japanese-School-in-London students-teachers-number-data 2023-05.png 2,874 × 1,656; 247 KB
-
Kapacitetsfaktor svensk sol- och vindkraft säsongsvariation 2011-2021.png 1,920 × 1,440; 138 KB
-
Kapacitetsfaktor svensk sol- och vindkraft årsmedelvärden 2011-2021.png 1,920 × 1,440; 169 KB
-
Kapacitetsfaktor svensk vindkraft 2011-2021.png 1,920 × 1,440; 227 KB
-
Kenya Human Development Index computed by the UN.png 606 × 340; 10 KB
-
KM zuhaitza22.png 1,223 × 939; 190 KB
-
Knowledge graph entity alignment.png 1,221 × 650; 110 KB
-
Koldo Mitxelena Zuhaitz Akademikoa (tesiak).png 1,038 × 768; 129 KB
-
Konigsberg-grafoa.svg 171 × 125; 2 KB
-
LAMF - 2023.png 1,375 × 495; 176 KB
-
Local service graph.png 865 × 578; 82 KB
-
LociEffects.png 1,267 × 739; 98 KB
-
LSDEmergencyRoom.gif 358 × 395; 5 KB
-
M1 Garand Users (Updated).png 6,460 × 3,403; 2.34 MB
-
Magnus Carlsen Elo february 2023.svg 783 × 583; 258 KB
-
Markov Chain for String Generation Example.png 808 × 535; 26 KB
-
Mars Rover Comparison Distance Graph.svg 576 × 432; 245 KB
-
Martensite to Austenite transition graph.svg 886 × 567; 46 KB
-
ME-CFS Incidence Rate by Age.png 494 × 336; 11 KB
-
Microsoft Edge 1 27 2020 1 18 47 AM (2).png 487 × 377; 80 KB
-
Mixed service graph.png 892 × 561; 55 KB
-
Mormon missionaries and conversions over time.svg 600 × 400; 60 KB
-
Morts dus à la guerre Israël-Gaza depuis 2023.png 942 × 531; 46 KB
-
Multidigraph NetworkX.png 660 × 499; 32 KB
-
Multigene Population Genetics and Microevolutionary Theory3 .12 book.png 882 × 1,232; 168 KB
-
Multigraph NetworkX.png 660 × 499; 37 KB
-
MURDERS IN NEW YORK CITY BY YEAR.png 600 × 371; 26 KB
-
Natural gas consumption in China.jpg 361 × 216; 14 KB
-
Nelson-diagramm.svg 293 × 284; 79 KB
-
Netflix Original Movies.svg 512 × 362; 166 KB
-
NetworkGraph.png 2,012 × 1,132; 307 KB
-
Nombre d’articles faisant référence au « néolibéralisme » entre 1930 et 1990.jpg 1,058 × 725; 200 KB
-
NumPlayer vs. Year.png 1,328 × 1,110; 54 KB
-
O(N-P) vs O(N).png 1,874 × 1,198; 910 KB
-
Old Order Amish in the 20th century.png 825 × 619; 73 KB
-
One way shape memory effect.svg 797 × 407; 45 KB
-
Optimalalpha.png 1,686 × 1,103; 121 KB
-
Orgasm.png 800 × 600; 40 KB
-
OrgasmTime.jpg 842 × 595; 41 KB
-
OSMBC Patronage 2017-20.jpg 901 × 557; 55 KB
-
ParetoFront nicht konvex.png 1,926 × 1,644; 70 KB
-
Partial autocorrelation function.png 480 × 480; 4 KB
-
PEPP Graph Improved.png 4,262 × 1,980; 710 KB
-
PEPP Graph.png 4,262 × 1,980; 696 KB
-
Pop distribution.png 2,048 × 2,048; 286 KB
-
Population History.svg 600 × 371; 38 KB
-
Population of Gulshan-e-Iqbal.png 1,799 × 1,075; 202 KB
-
Problem Solving Process.png 445 × 445; 59 KB
-
Product X Example S-Curve Waters.jpg 534 × 292; 25 KB
-
PropagationGraphPartialResponseAnimation.png 1,211 × 937; 2.95 MB
-
Proportionalität graphisch dargestellt 1 2017 PD.svg 2,126 × 1,594; 30 KB
-
Proportionalität graphisch dargestellt 10 2017 PD.svg 2,126 × 1,594; 24 KB
-
Proportionalität graphisch dargestellt 11 2017 PD.svg 2,657 × 2,303; 41 KB
-
Proportionalität graphisch dargestellt 12 2017 PD.svg 3,189 × 3,189; 99 KB
-
Proportionalität graphisch dargestellt 12a 2017 PD.svg 3,189 × 3,189; 99 KB
-
Proportionalität graphisch dargestellt 2 2017 PD.svg 2,126 × 1,594; 23 KB
-
Proportionalität graphisch dargestellt 20 2017 PD.svg 2,657 × 1,594; 33 KB


.jpg/120px-2020_04_21_-_Gabinete_crisis_y_posterior_rueda_de_prensa_(49801918707).jpg)


.jpg/120px-500k_(5141388411).jpg)


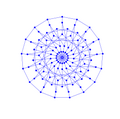


_-_ECU-EUR_vs_USD_currency_change_(1972-2022).png/120px-Cambio_ECU-EUR_vs_USD_(1972-2022)_-_ECU-EUR_vs_USD_currency_change_(1972-2022).png)


.png/120px-Chronopilic_prefererred_ages_graph_(blank).png)
.png/120px-Chronopilic_prefererred_ages_graph_(english).png)
.png/120px-Chronopilic_prefererred_ages_graph_(french).png)
.png/120px-Chronopilic_prefererred_ages_graph_(german).png)
.png/120px-Chronopilic_prefererred_ages_graph_(italian).png)
.png/120px-Chronopilic_prefererred_ages_graph_(spanish).png)




_scale.jpg/120px-Cumulative_density_plot_of_all_systems_over_the_e-mental_Health_Degree_of_Technological_Sophistication_(eHDTS)_scale.jpg)



.jpeg/120px-Dsc_0539_Jpg_(115242903).jpeg)
)_Ingestion_I-131_2014-12-10.png/120px-DSD(t-A(d))_Ingestion_I-131_2014-12-10.png)
_I131_Inhalation_2014-12-10.png/120px-DSD(t-A-m3)_I131_Inhalation_2014-12-10.png)

_°_CO2_emissions_per_capita_-_Russia-USSR_(1912-1932).png/120px-Emissioni_CO2_pro-capite_-_Russia-URSS_(1912-1932)_°_CO2_emissions_per_capita_-_Russia-USSR_(1912-1932).png)
_-_CO2_emissions_per_capita_in_UK_(1800-1873).png/120px-Emissioni_CO2_pro-capite_nel_Regno_Unito_(1800-1873)_-_CO2_emissions_per_capita_in_UK_(1800-1873).png)




.jpg/120px-Figure_1-_International_Space_Station_Funding_by_Budget_Element_for_Fiscal_Years_2010_through_2020_(20156685839).jpg)
.jpg/120px-Figure_1-_Monthly_West_Texas_Intermediate_and_Brent_Crude_Oil_Prices%2C_2009-May_2015_(19779909169).jpg)




.jpg/73px-Functions_(graph).jpg)


_-_Italian_general_elections_graph_(1946-2022).svg/120px-Grafico_delle_elezioni_politiche_in_Italia_(1946-2022)_-_Italian_general_elections_graph_(1946-2022).svg.png)
.png/120px-Graph_(y_%3D_0.5x_-_1).png)
.svg/120px-Graph_(y_%3D_0.5x_-_1).svg.png)


.png/120px-Graph_Rates_of_STD_by_Race_in_the_United_States_from_2015_to_2020%2C_TSH_(cropped).png)
.png/120px-Graph%2C_Percent_of_STD_cases%2C_per_100%2C000%2C_by_week_in_2020_in_the_United_States%2C_Timothy_Holdiness_(cropped).png)








.png/120px-Key_for_Percent_of_STD_cases%2C_per_100%2C000%2C_by_week_in_2020_in_the_United_States%2C_Timothy_Holdiness_(cropped).png)
.png/120px-Key_for_Rates_of_STD_by_Race_in_the_United_States_from_2015_to_2020%2C_TSH_(cropped).png)


.png/120px-Koldo_Mitxelena_Zuhaitz_Akademikoa_(tesiak).png)


.png/120px-M1_Garand_Users_(Updated).png)


.png/120px-Microsoft_Edge_1_27_2020_1_18_47_AM_(2).png)


_vs_O(N).png/120px-O(N-P)_vs_O(N).png)


